Hey Coal Traders, the Q3 2026 edition of our U.S. Quarterly Coal Production report is live, along with updated data in our interactive production tool. A few excerpts.
On the headline number:
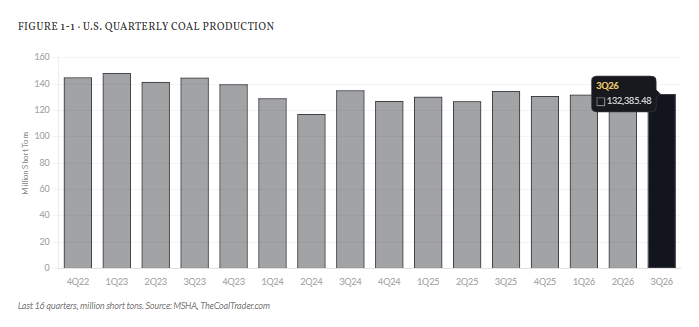
Total U.S. coal production reached an estimated 132.4 million short tons in Q3 2026, a sequential increase of 5.6% from Q2 and down 1.6% against Q3 2025. Third-quarter production typically rises as summer cooling demand lifts coal burn and utilities rebuild stockpiles drawn down in the spring. Since 2010, the median third quarter has risen 6.5% from the second. This quarter’s gain was broadly in line with that pattern.
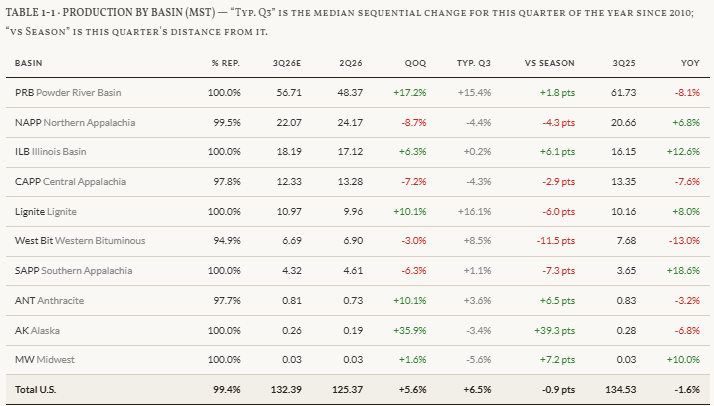
As in our previous edition, Table 1-1 includes a seasonal comparison column, showing each basin’s typical sequential change for the quarter since 2010 and how far this quarter’s performance deviated from that norm.
On the regional split:
Regional performance varied considerably. Powder River Basin (PRB) production recovered 17.2% sequentially, broadly in line with its typical third-quarter gain of 15.4%. But at 56.7 Mst, output remained 8.1% below a year earlier.
The Appalachian basins all declined more sharply than their seasonal norms. Northern Appalachia (NAPP) fell 8.7% against a typical third-quarter decline of 4.4%, with roughly 60% of the tonnage reduction concentrated at two Pittsburgh seam thermal longwalls: ACNR’s McElroy and Core Natural Resources’ Enlow Fork.
The more unusual divergence came from the Illinois Basin and Western Bituminous regions. Illinois Basin production rose 6.3% against a typical gain of just 0.2%, led by a 1.3 Mst increase at Alliance Resource Partners’ Hamilton complex. Western Bituminous production, meanwhile, declined 3.0% against a typical third-quarter increase of 8.5%, or 11.5 points below its seasonal norm. Declines at Peabody’s El Segundo and the Colowyo mine, which reported no third-quarter production, more than offset stronger production at NTEC’s Navajo mine.
Source: MSHA, TheCoalTrader.com
On metallurgical coal, where the story gets more interesting:
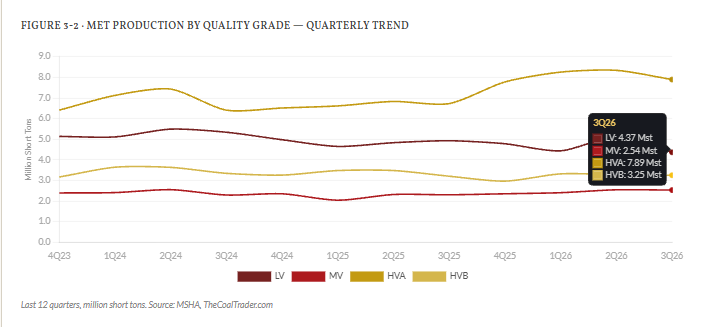
U.S. metallurgical coal production fell 6.4% sequentially to 18.1 Mst, while thermal production rose 7.8%. On a year-over-year basis, however, met production remained 5.1% higher, against a 2.6% decline in thermal coal.
The largest sequential contraction came in low-volatile hard coking coal, where production fell 14.7% to 4.37 Mst. Geological problems at Coronado’s Buchanan mine and Warrior Met Coal’s No. 7 mine each removed roughly 0.27 Mst of quarterly output, with Oak Grove down another 0.13 Mst.
High-vol A production also declined, falling 5.4% sequentially to 7.89 Mst, although output remained 17.3% higher year over year. That increase continues to reflect the ramp-up at Warrior’s Blue Creek and Core’s Leer South operations, which together added roughly 1.8 Mst from a year earlier.
On high-vol supply, the section we think matters most this quarter:
In our Q2 report, we highlighted two emerging supply constraints: the fire at Allegheny Met’s Longview mine and the damage to Dominion Terminal Associates’ stacker-reclaimer in Newport News. Both have now begun to show up in the numbers, although their market implications differ.
The August 12 fire at Longview roughly halved the mine’s quarterly production, from 0.90 Mst in Q2 to 0.48 Mst in Q3. Allegheny has guided to a six-month shipment outage, although market sources believe that timetable may be optimistic given the operation’s previous restart experience. Its disappearance from the spot market preceded a sharp recovery in East Coast high-vol A prices, from $151/t in late August to $185.50/t by mid-September.
That said, the broader supply picture remains challenging. High-vol A production was still 1.17 Mst higher year over year, and our East Coast high-vol A quarterly average of $162.70/t was essentially unchanged from a year earlier. Over the same period, Australian premium low-vol rose 35% to $247.90/t. As a result, U.S. high-vol A averaged just 66% of the benchmark, down from 88% a year ago.
At DTA, Alpha confirmed on its November 6 earnings call that the damaged stacker-reclaimer will have to be replaced rather than repaired, with a custom-built replacement on a lengthy timeline. Nevertheless, the company managed to ship 3.9 million tons during Q3 by routing coal through alternative Hampton Roads terminals. That compares with 3.60 Mst of mine-level production in our dataset, suggesting inventories were drawn down rather than accumulated during the quarter.
On the publicly traded producers:
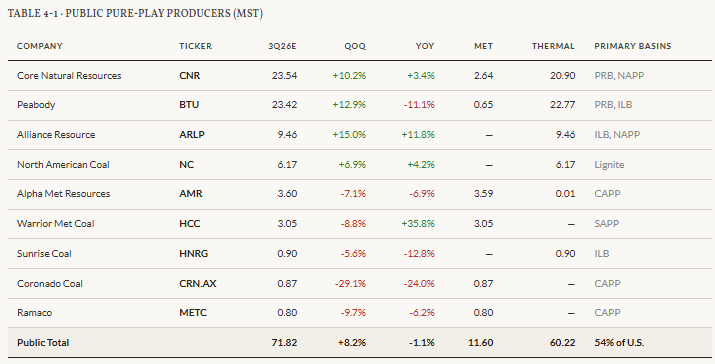
Publicly traded pure-play coal producers accounted for approximately 71.8 Mst, or 54% of total U.S. production, during Q3. Their aggregate output rose 8.2% sequentially but slipped 1.1% year over year.
Warrior Met Coal (HCC) recorded the strongest year-over-year performance among the publicly traded operators, with output rising 35.8% as Blue Creek continued its ramp-up. Coronado (CRN.AX), meanwhile, saw U.S. production decline 24.0% year over year and 29.1% sequentially, primarily due to the geological fault encountered at Buchanan.
On the thermal side, Peabody’s (BTU) production rose 12.9% sequentially, driven almost entirely by North Antelope Rochelle. The recovery was nevertheless weaker than management anticipated: PRB shipments reached 19.6 million tons against a 22 million ton target, with lower-than-expected coal burn limiting demand.
Alliance Resource Partners (ARLP) led the publicly traded group sequentially, with production up 15.0%, supported by the sharp recovery at Hamilton.
Source: MSHA, TheCoalTrader.com
Also in this edition: Detailed metallurgical production by quality grade, quarterly trends for publicly traded operators, a producer scorecard mapping companies to their tickers and their met/thermal output, basin-level company rankings, and mine-complex production comparisons with current-quarter, sequential and year-over-year data. The report also provides reporting coverage by basin and a methodology discussion.
The updated dataset covers 346 producing mines, representing 99.4% of estimated U.S. coal production. The interactive tool lets subscribers move beyond the national totals and drill into the basins, companies and individual mine complexes that matter to their analysis.
And a reminder that The Annual Premium Bundle is $699/year, including the quarterly reports, interactive data tools, the rest of our data platform and, of course, this Substack. The nearest comparable commercial product we’ve identified costs approximately $3,000/year and is delivered as a static PDF rather than an interactive database.
For anyone following U.S. coal equities, we think the ability to trace production from an individual mine through its operating company and into the broader market is particularly valuable. That’s what we’ve built.
Links to the report, interactive production tool and subscription plans are below.
-MW
Quarterly Production Report:
https://www.thecoaltrader.com/us-coal-production-report/
Interactive Production Tool:
https://www.thecoaltrader.com/us-coal-production-tool/
Premium Subscription:
https://thecoaltrader.com/pricing-tier-plans/